


Book Preview

Below are just a few of the images showcased in A History of America in 100 Maps. Through lively prose and attention to detail, the book explores maps that shaped wartime strategy and peacetime reform, exploration and discovery as well as education and entertainment.
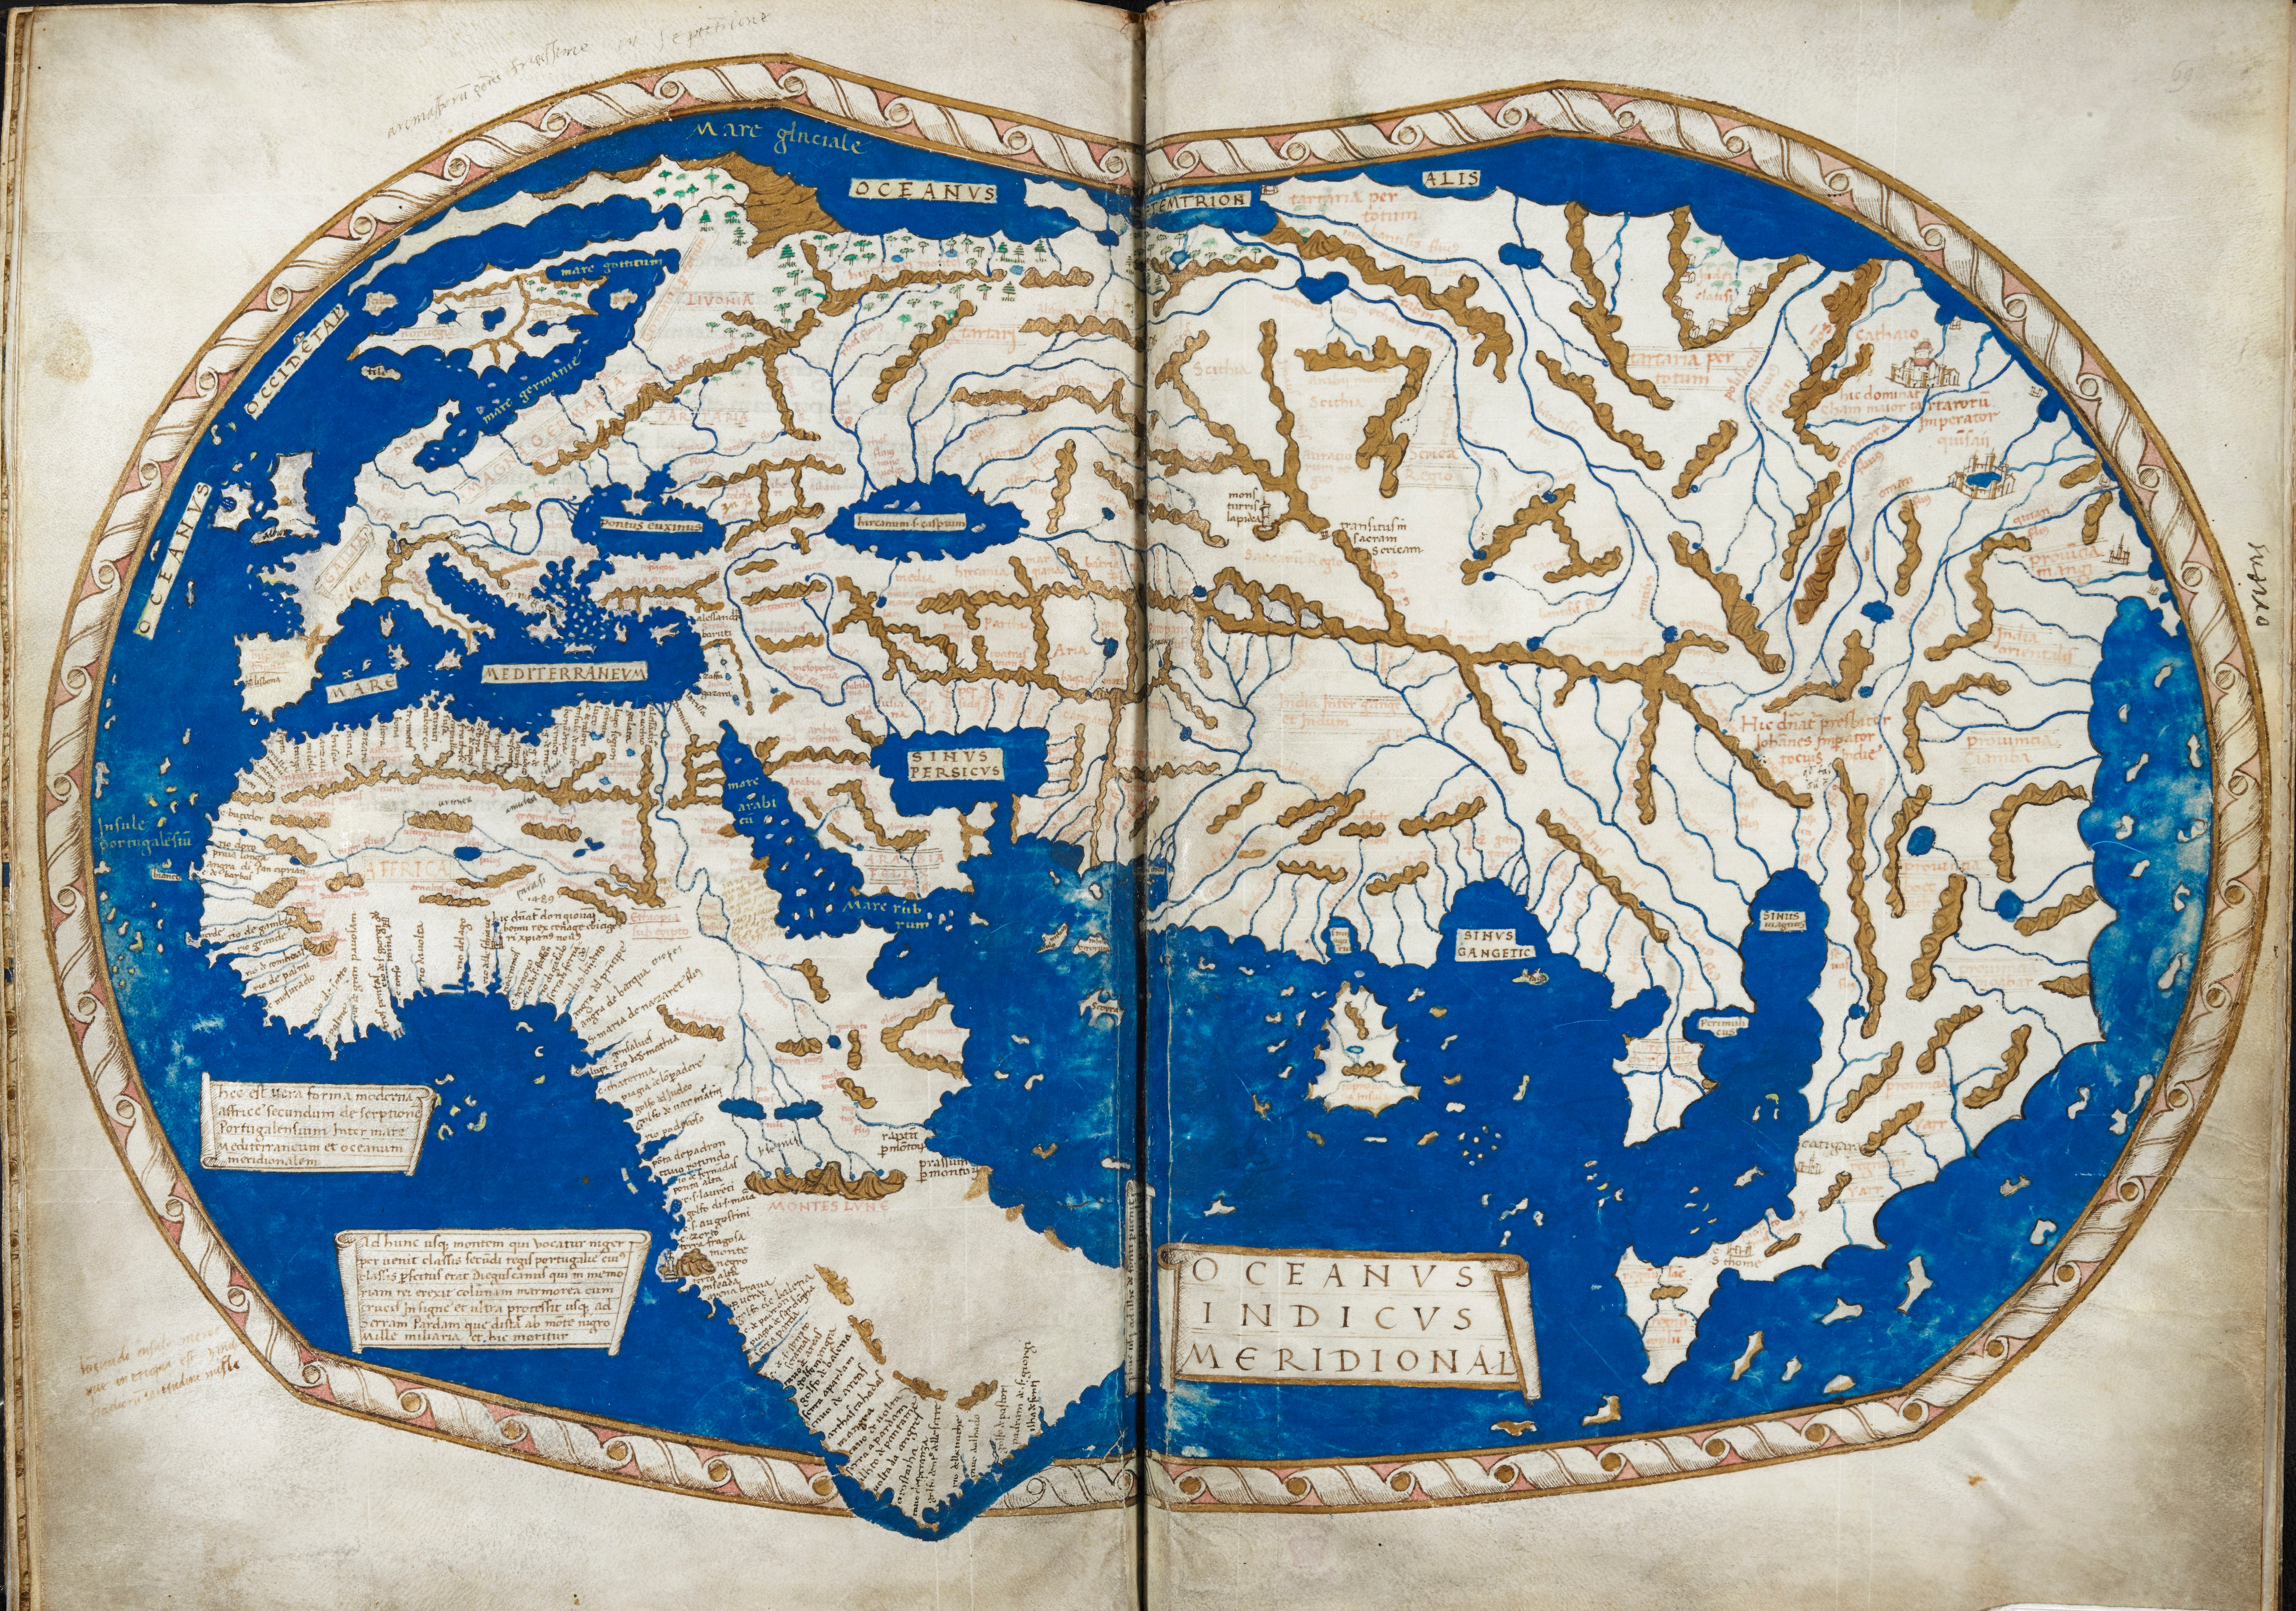
The World Before Columbus
Here is the world as it was known in 1490, which led Christopher Columbus to sail west from Europe in search of Asia. Though he was among the earliest Europeans to reach the Caribbean, Columbus spent the rest of his life thinking he had reached the East Indies. Chapter one of this book explores the geographical confusion that ensued, and the struggle to make sense of the western hemisphere around 1500.
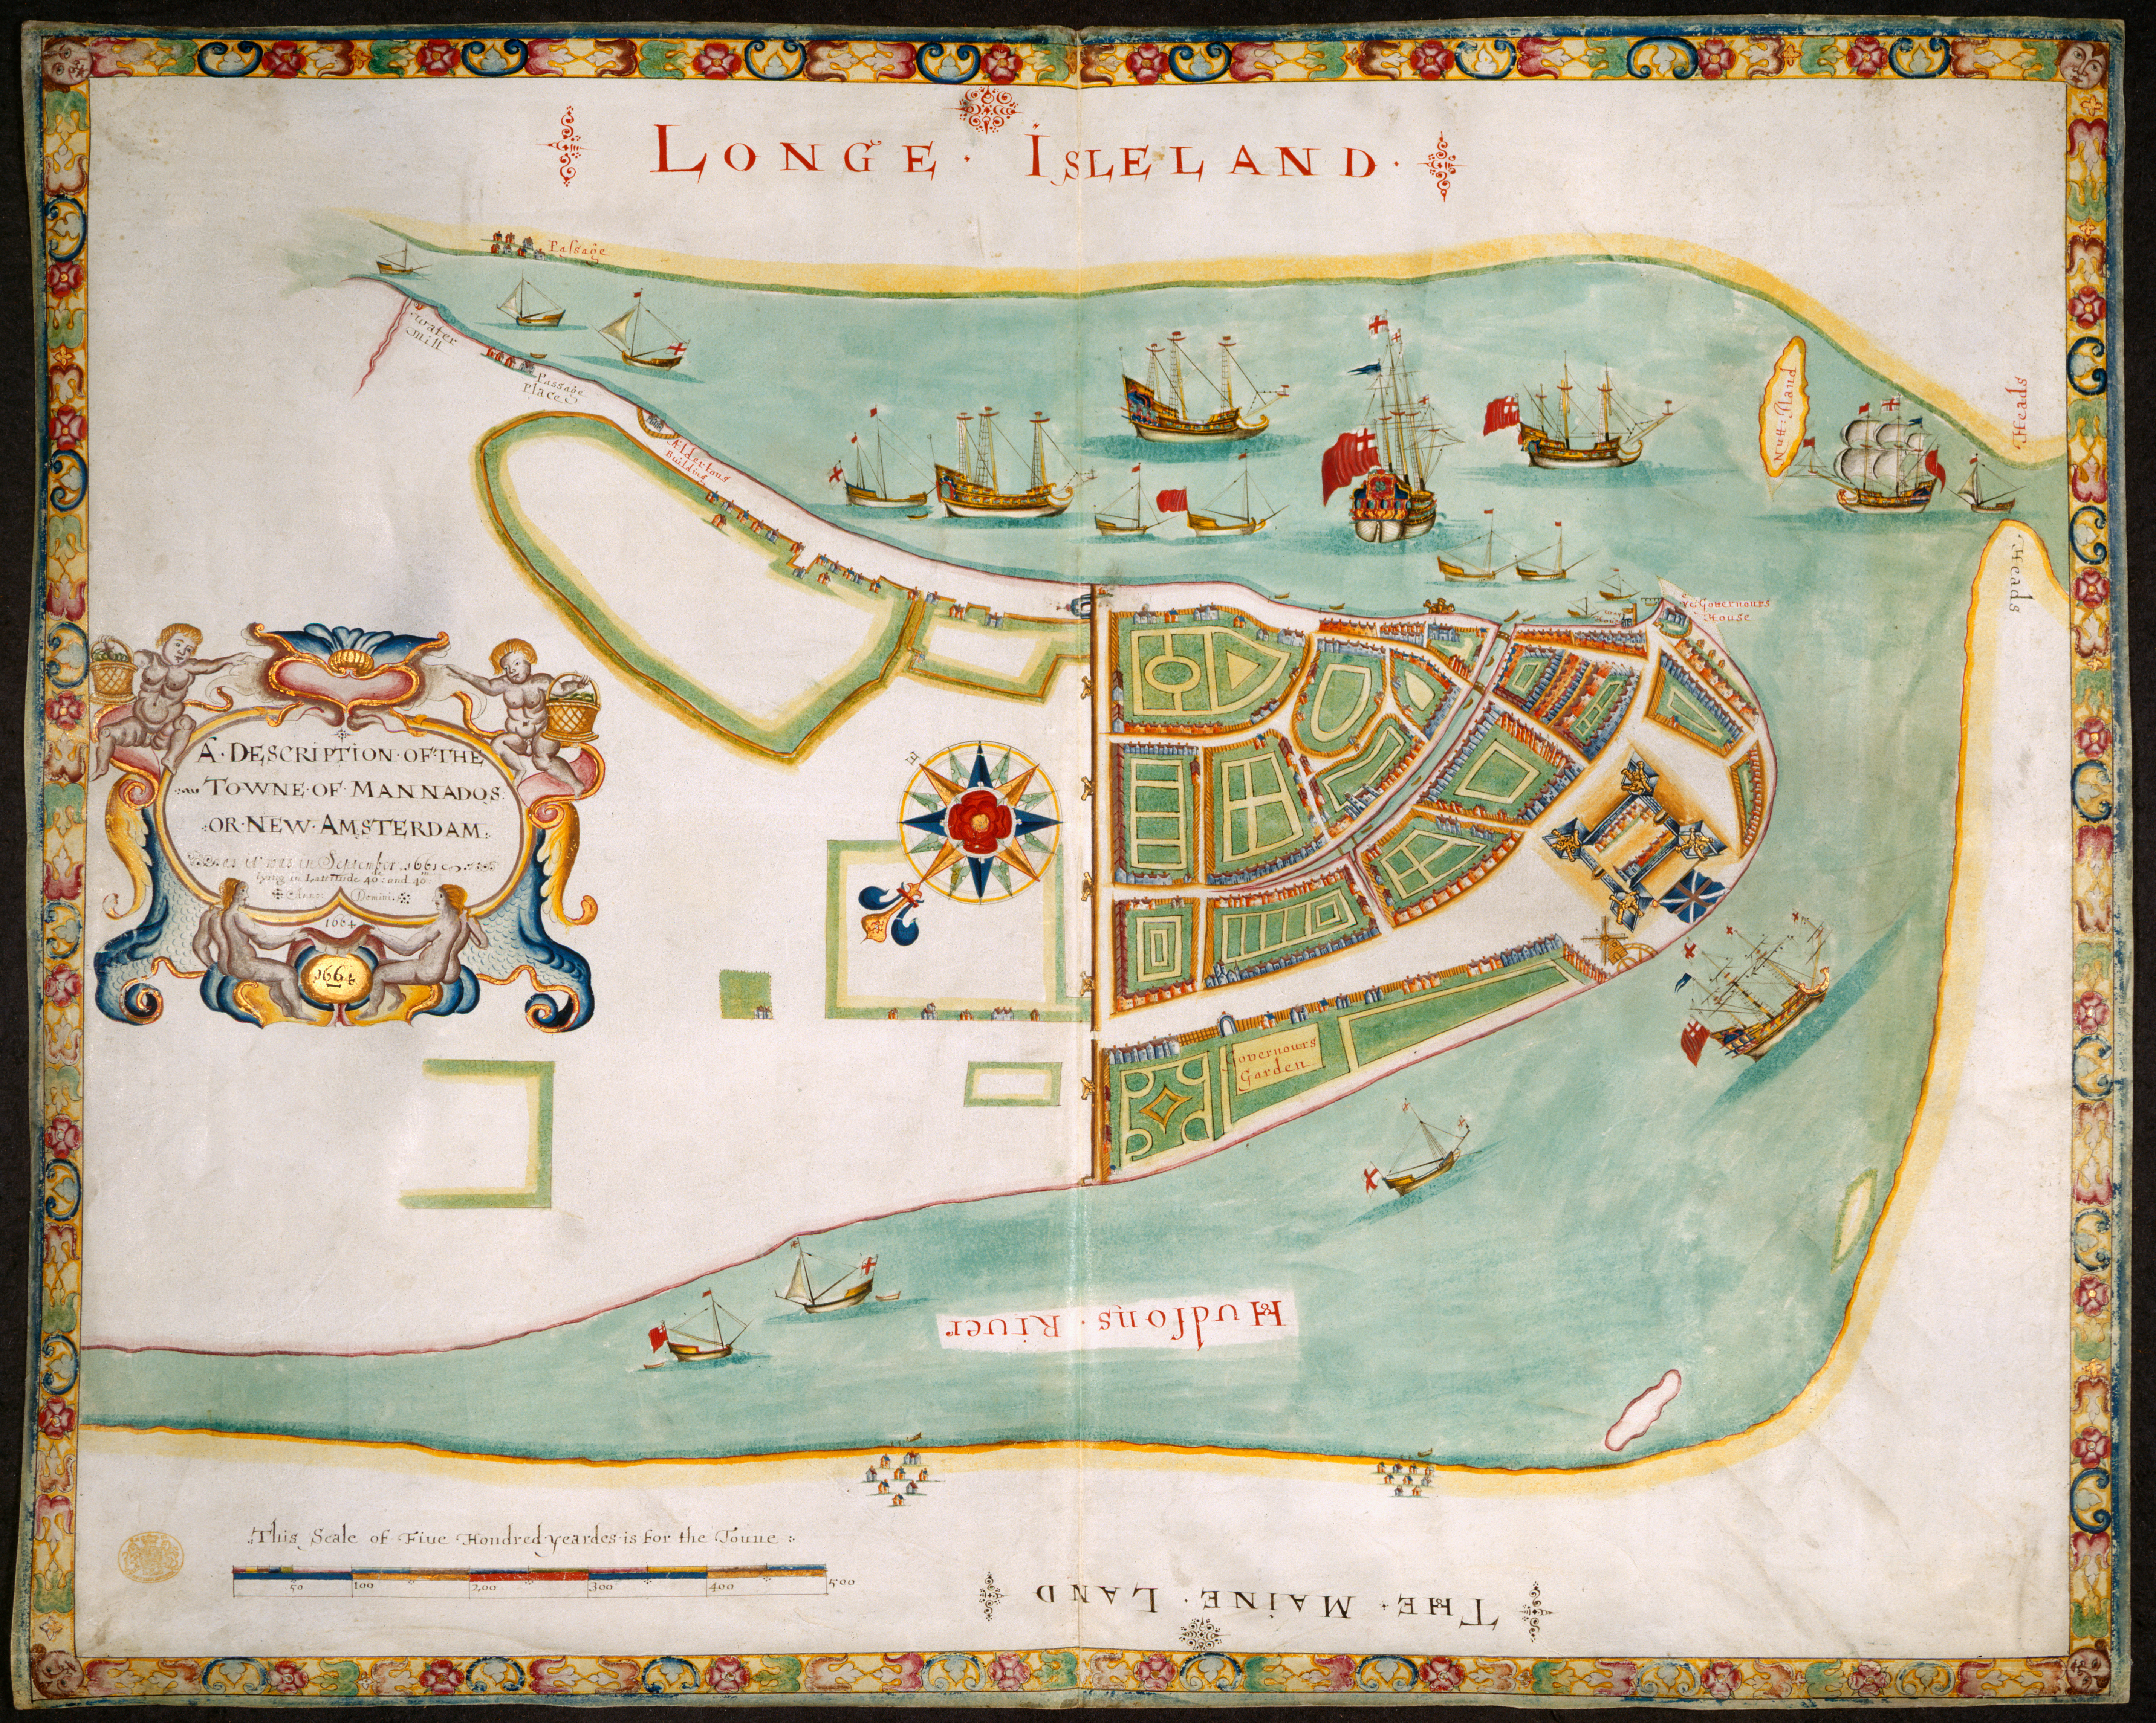
I'll Take Manhattan
In 1664 the Dutch lost control of "New Amsterdam" to the English, who promptly renamed it "New York". This exuberant map of Manhattan commemorates the English victory over the Dutch, and explains the origin of place names like Battery Park and Wall Street. Chapter two of the book documents the imperial rivalries in North America, and the powerful indigenous presence that preceded them all.
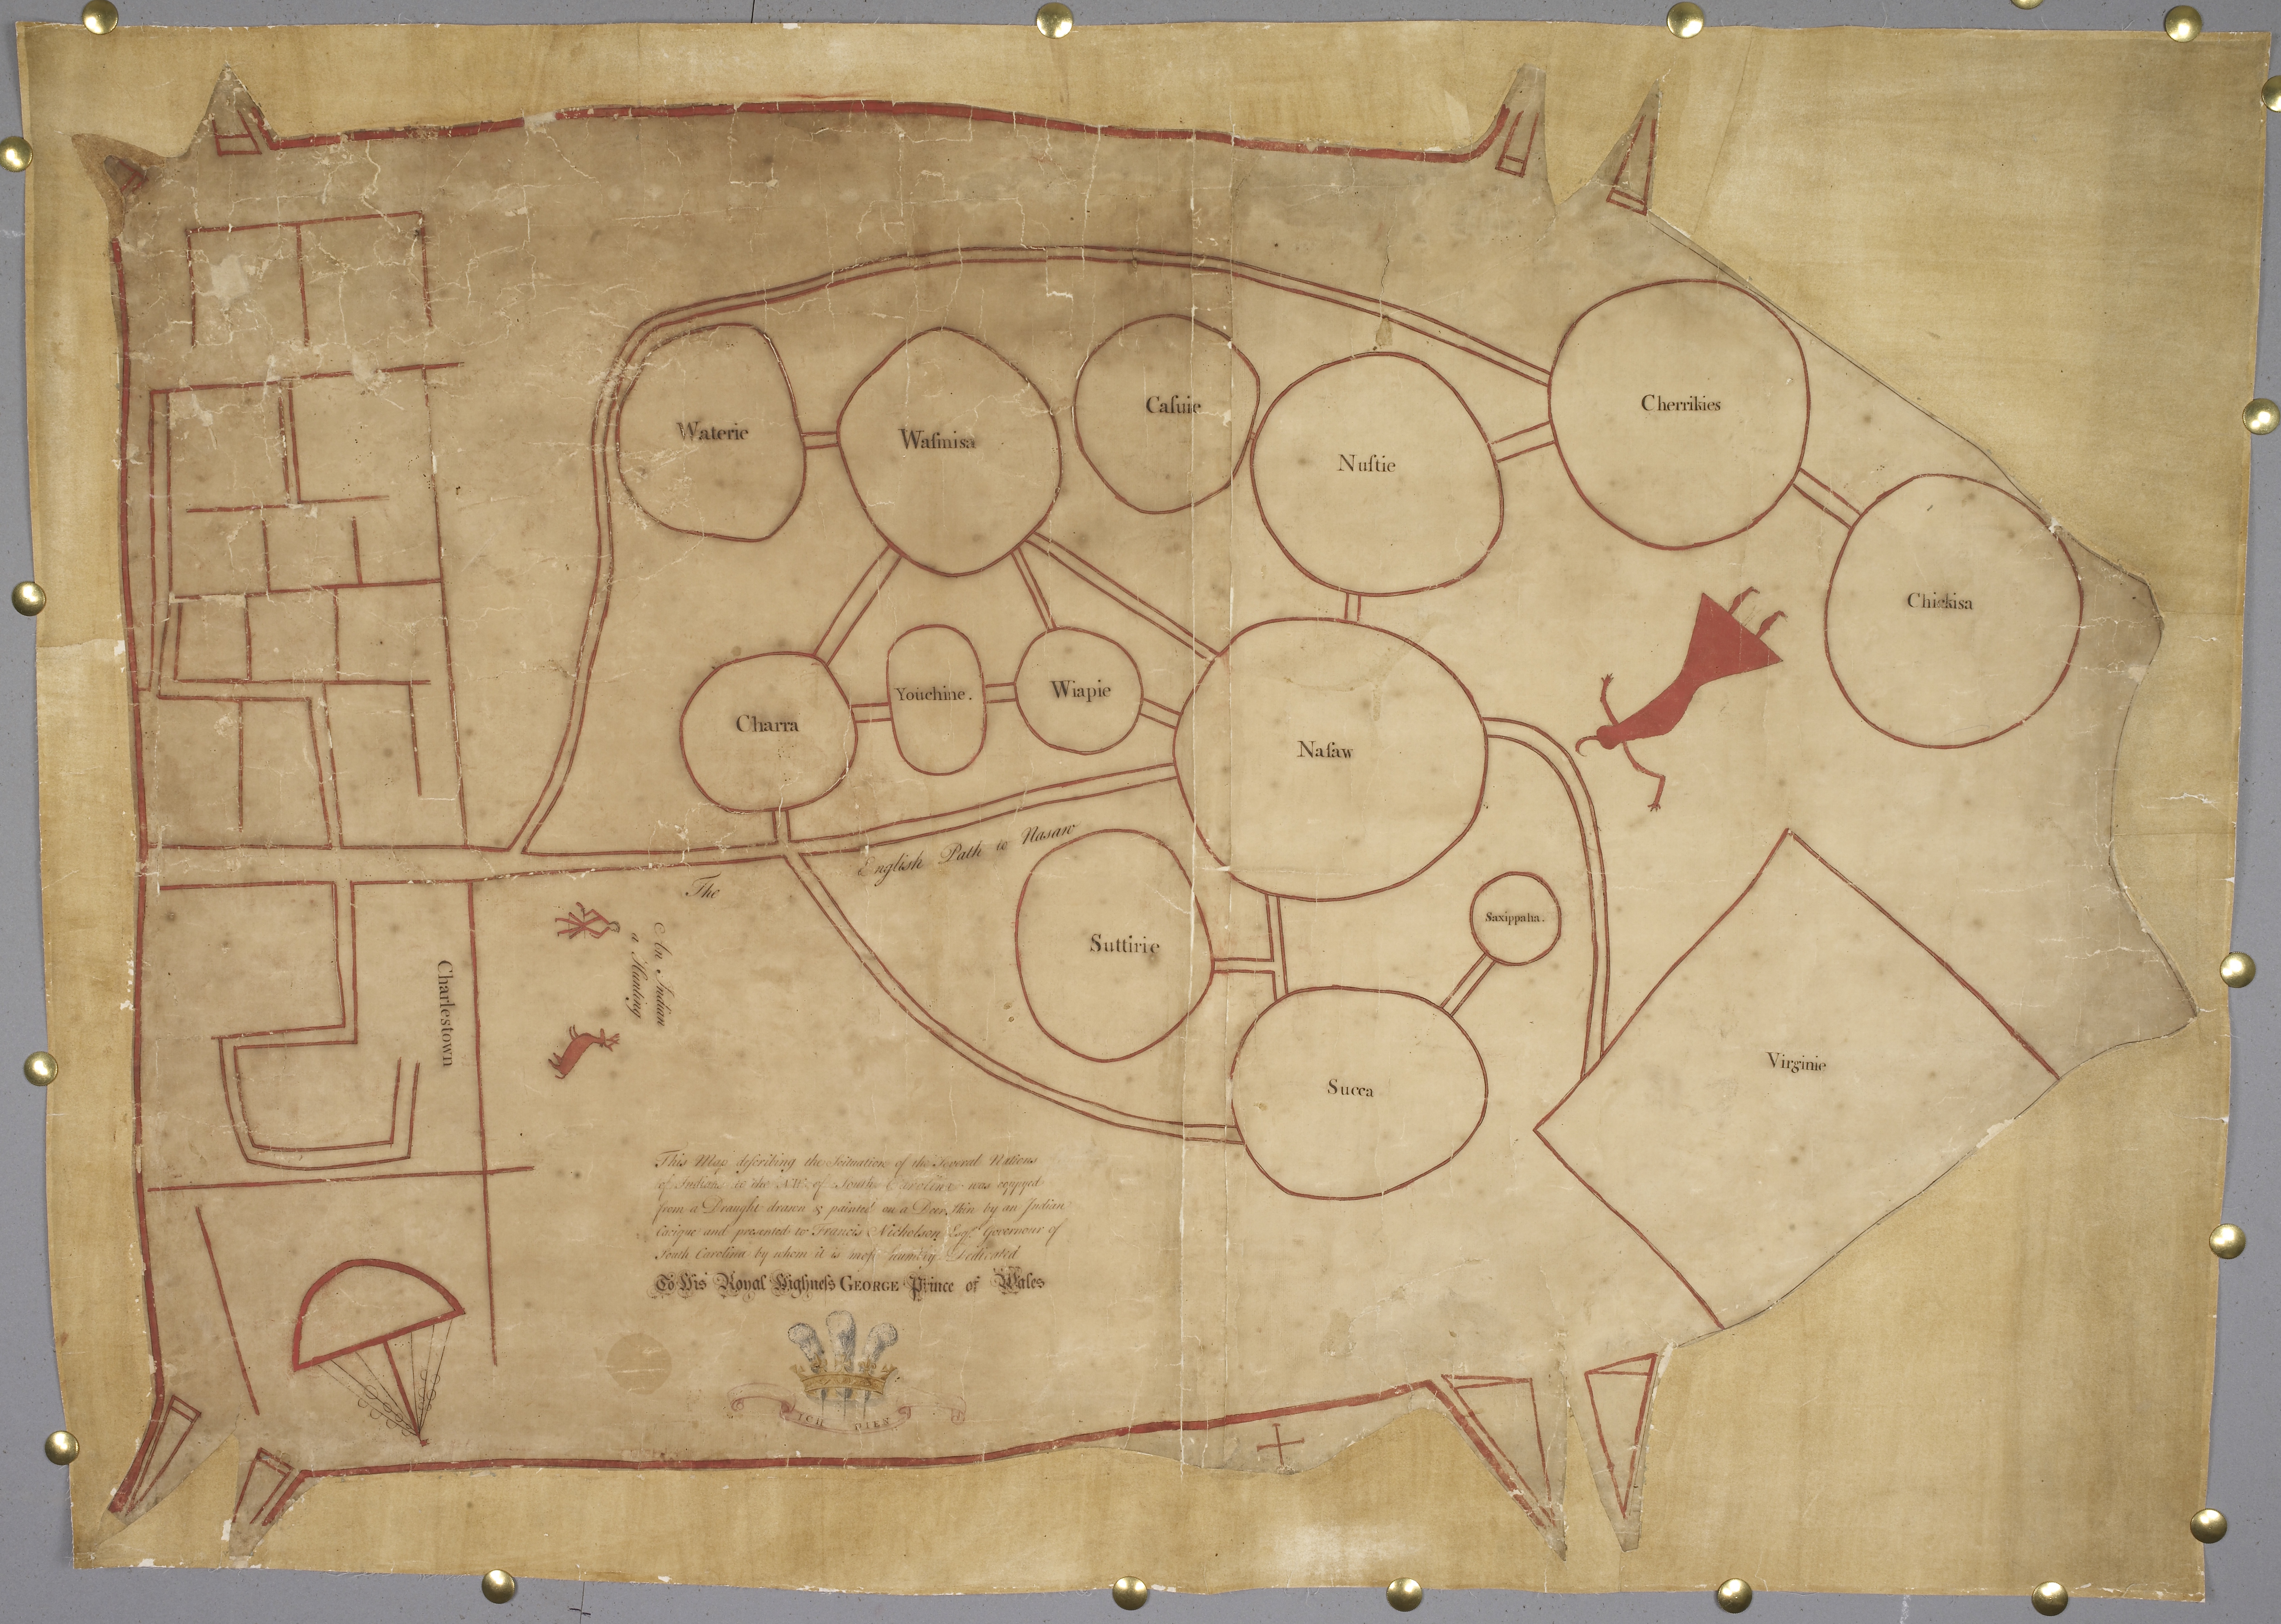
An Indigenous View of the Deerskin Trade
At first glance this image looks like a confusing organizational chart, but when decoded with care it reveals an invaluable Native American perspective on the imperial rivalries of the eighteenth century. The circles represent the relative power of tribes of the Southeast, each of which was angling for supremacy in the highly competitive deerskin trade with the British colonies. Chapter three unpacks complex maps such as these that illuminate the quest for control of the continent and its resources.
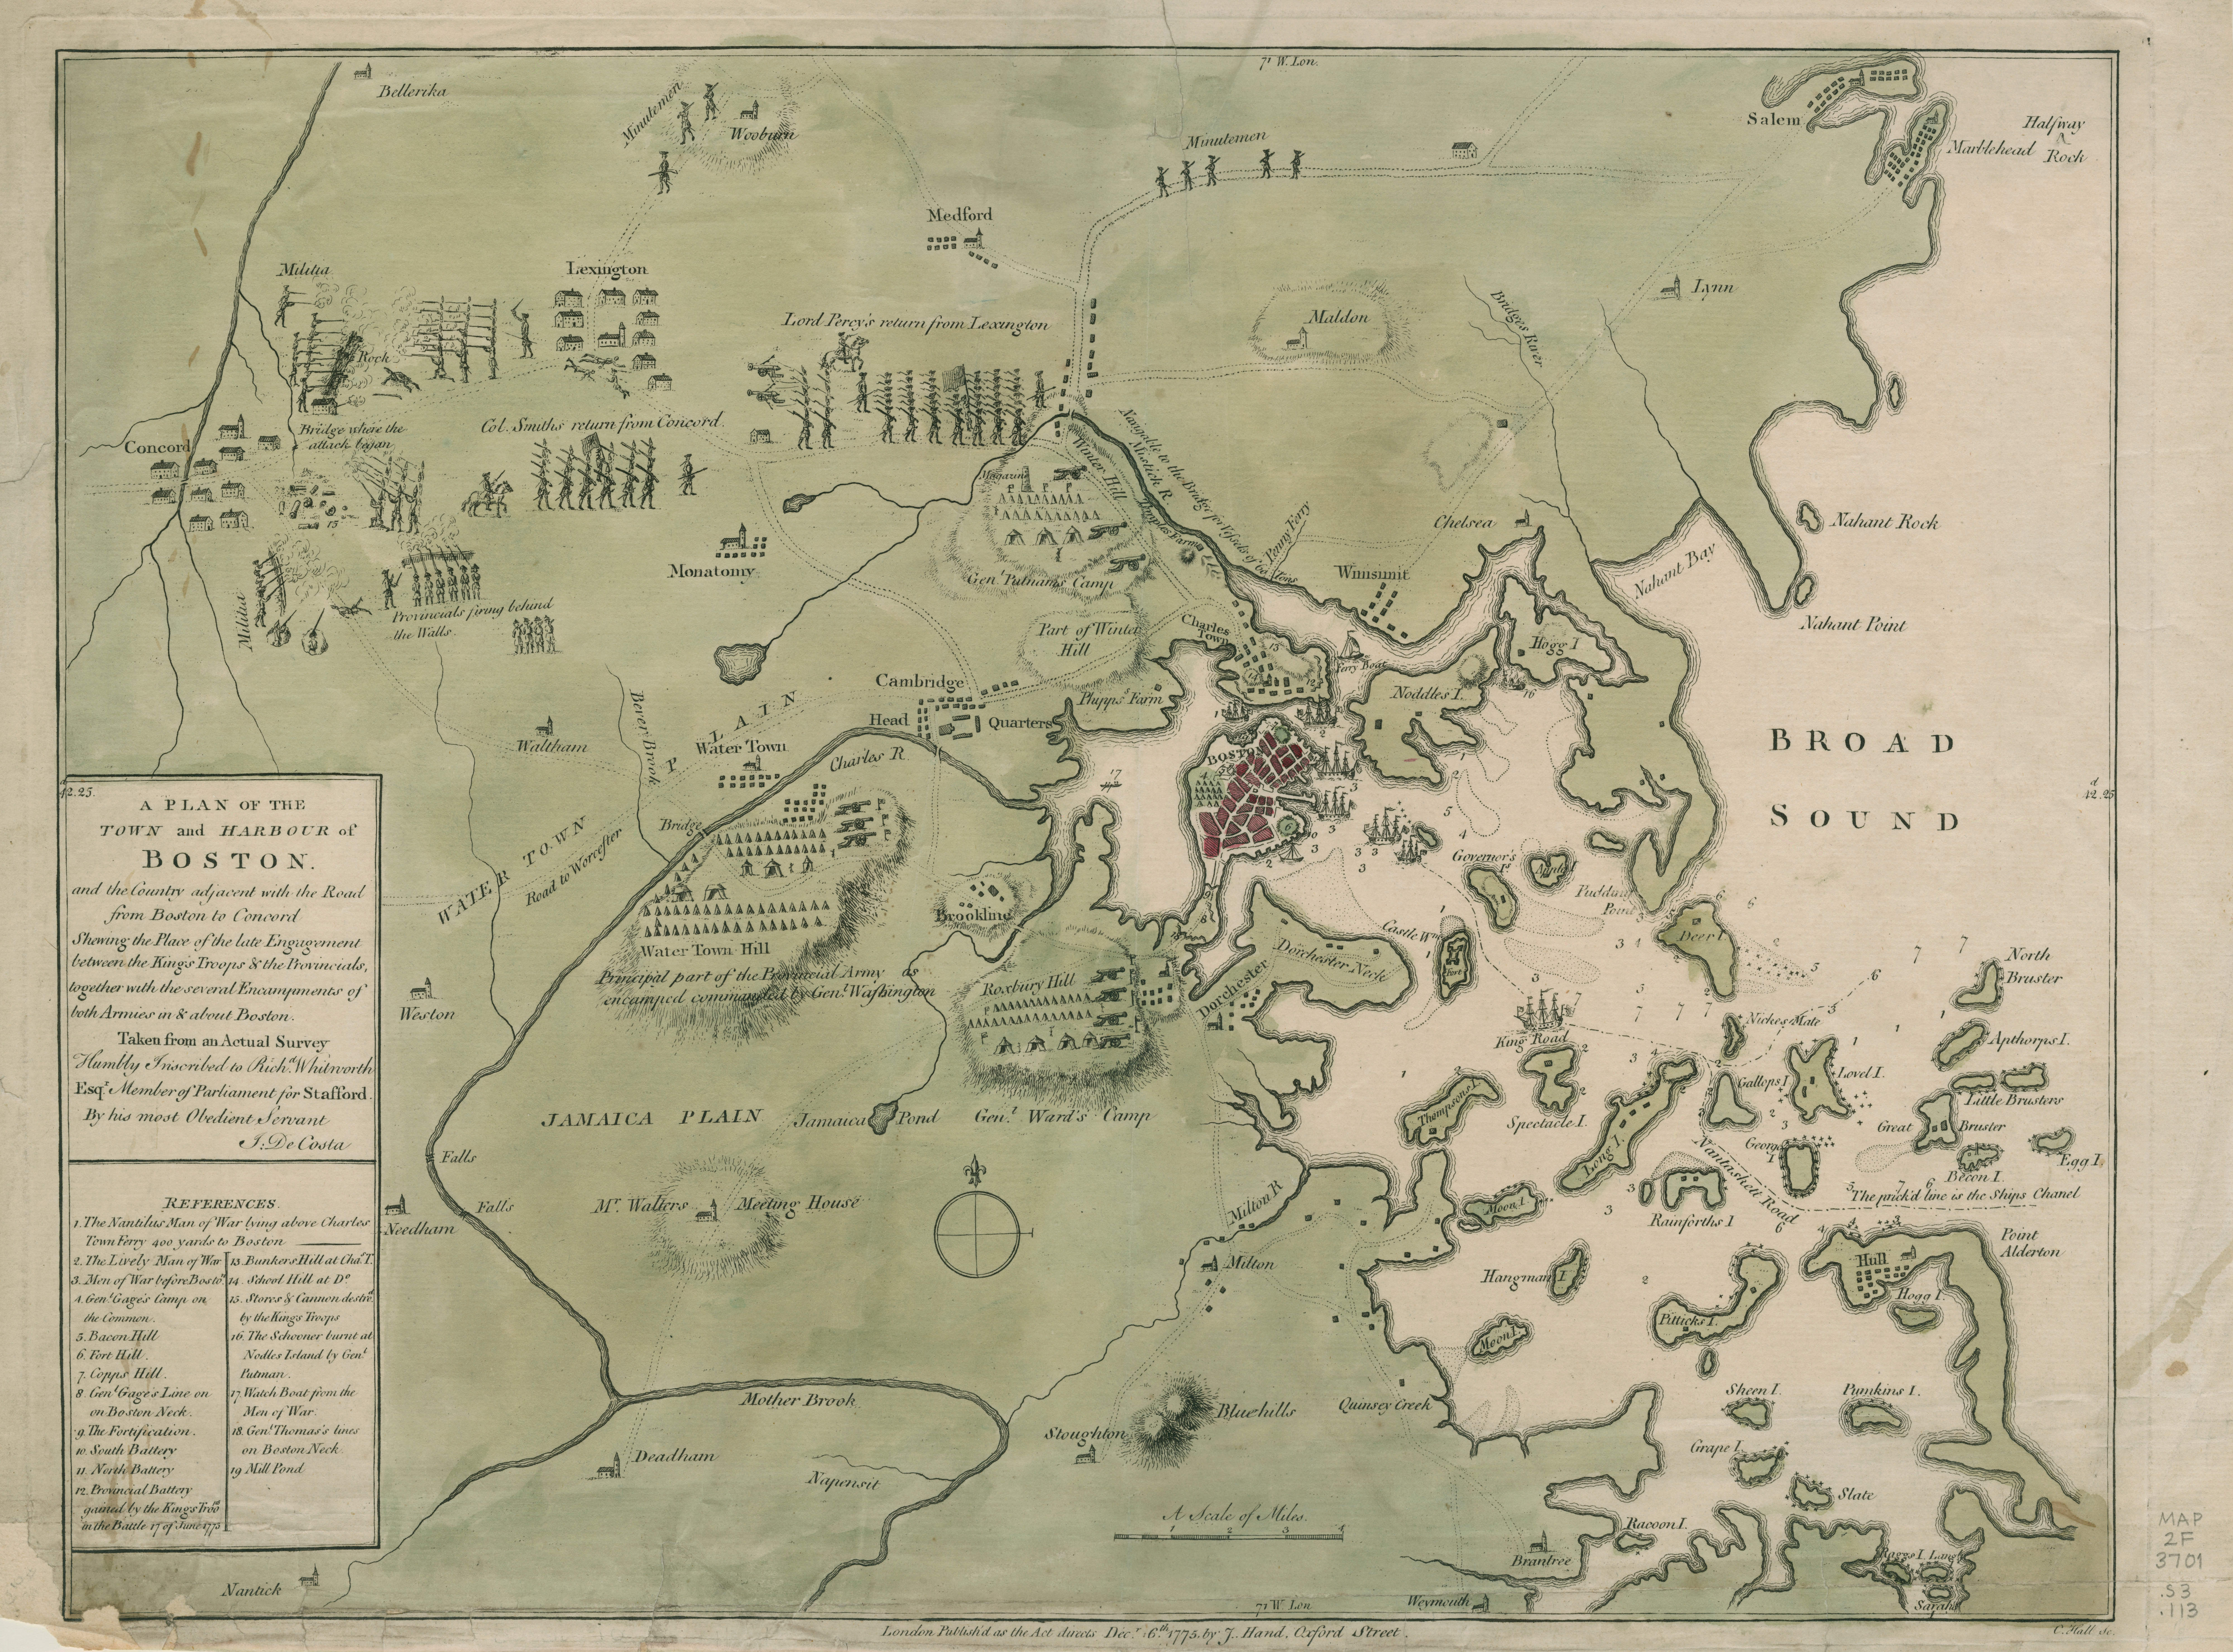
The Shot Heard Round the World
In the summer of 1775, the British Army marched west from Boston to subdue the American rebels in Concord and Lexington. These skirmishes became the opening shots of the American Revolution. This map conveyed the news to the British back home, making it the earliest map of what would become a war for independence. Chapter three explores these and other maps that shaped the imperial wars of the eighteenth century.
A Schoolgirl Maps Her Country
Just after the Revolution, thousands of young girls began to be educated outside the home for the first time in American history. Young Catharine Cook displays her knowledge of geography, art, and penmanship in this painstakingly produced map made as a school exercise. Notice her careful attention to detail, as well as her creative spelling of place names. Chapter four explores this and other maps that richly capture the complexities of antebellum America.
The Geography of Sin
From weddings and funerals to work and election day, alcohol was everywhere in antebellum life. Anti-alcohol activists effectively lowered consumption by using every means of persuasion at their disposal, including this imaginary map of a land where even moderate drinking ultimately led to desperation and ruin. Made by a Philadelphia minister, the map uses humor to convey the urgency of temperance, contributing to one of the most successful reform efforts in American history.
The Geography of Immigration
An enormous wave of immigration from Germany and Ireland fundamentally transformed the United States in the 1840s and 1850s. This map was designed to guide German emigrants to the most promising destinations, almost all of which lay outside the slave states of the American South. Chapter five explores this tumultuous era of expansion, migration, and the forces of industrialization and slave labor that ultimately contributed to the American Civil War.
Red States/Blue States
The heightened political partisanship of our own day has a long history, as shown in this early map of “red” and “blue” America, made to measure the electoral returns of the 1880 presidential election. The inset map at the bottom of the page shows a country divided after the Civil War, with the Democrats controlling the South while the Republicans dominate the North. But the larger map tells a much more nuanced story, one where neither party held an uncontested advantage.
The Map as a Weapon
After the completion of the transcontinental railroad, Chinese workers became the target of vicious prejudice throughout the west, particularly in California. The city fathers of San Francisco designed this map to characterize the residents of Chinatown as the scourge of the city, taking care to identify houses of prostitution, gambling, and opium dens. This is just one example of maps designed to navigate the unprecedented urbanization at the turn of the century.
To the Brink of Extinction
The expansion of the railroads nearly destroyed the bison population on the Great Plains. In response, a small but influential group of conservationists shocked the public by mapping the devastation of the species. Red lines show the expansive rangelands that had contracted to the smallest circles by the 1880s. Chapter six examines the profound shifts brought to the fragile ecosystem of the Far West in the late nineteenth century.
Music and Mayhem in Harlem
This energy of the jazz age courses through this map, made by Simms Campbell, the African-American illustrator who frequented many of these clubs with his close friend, the bandleader Cab Calloway. A wild and diverse cast of characters enjoys the illicit pleasures that brought more than a little mayhem to Harlem in the interwar era. Chapter seven uses this and other maps of the early twentieth century to trace the explosion of urban America, from New York and Chicago west to Los Angeles.
The Impact of Redlining on American Cities
The Great Depression devastated the nation’s housing market. In response, New Deal reformers of the 1930s enlisted real estate appraisers and experts across the country to assess local markets. This map of Cleveland was one of 239 made to “measure” the stability of different neighborhoods, one which had powerful and pernicious consequences for racial and ethnic minorities across the country. Chapter seven explores the upheaval of the interwar era, particularly the contours of urban life.
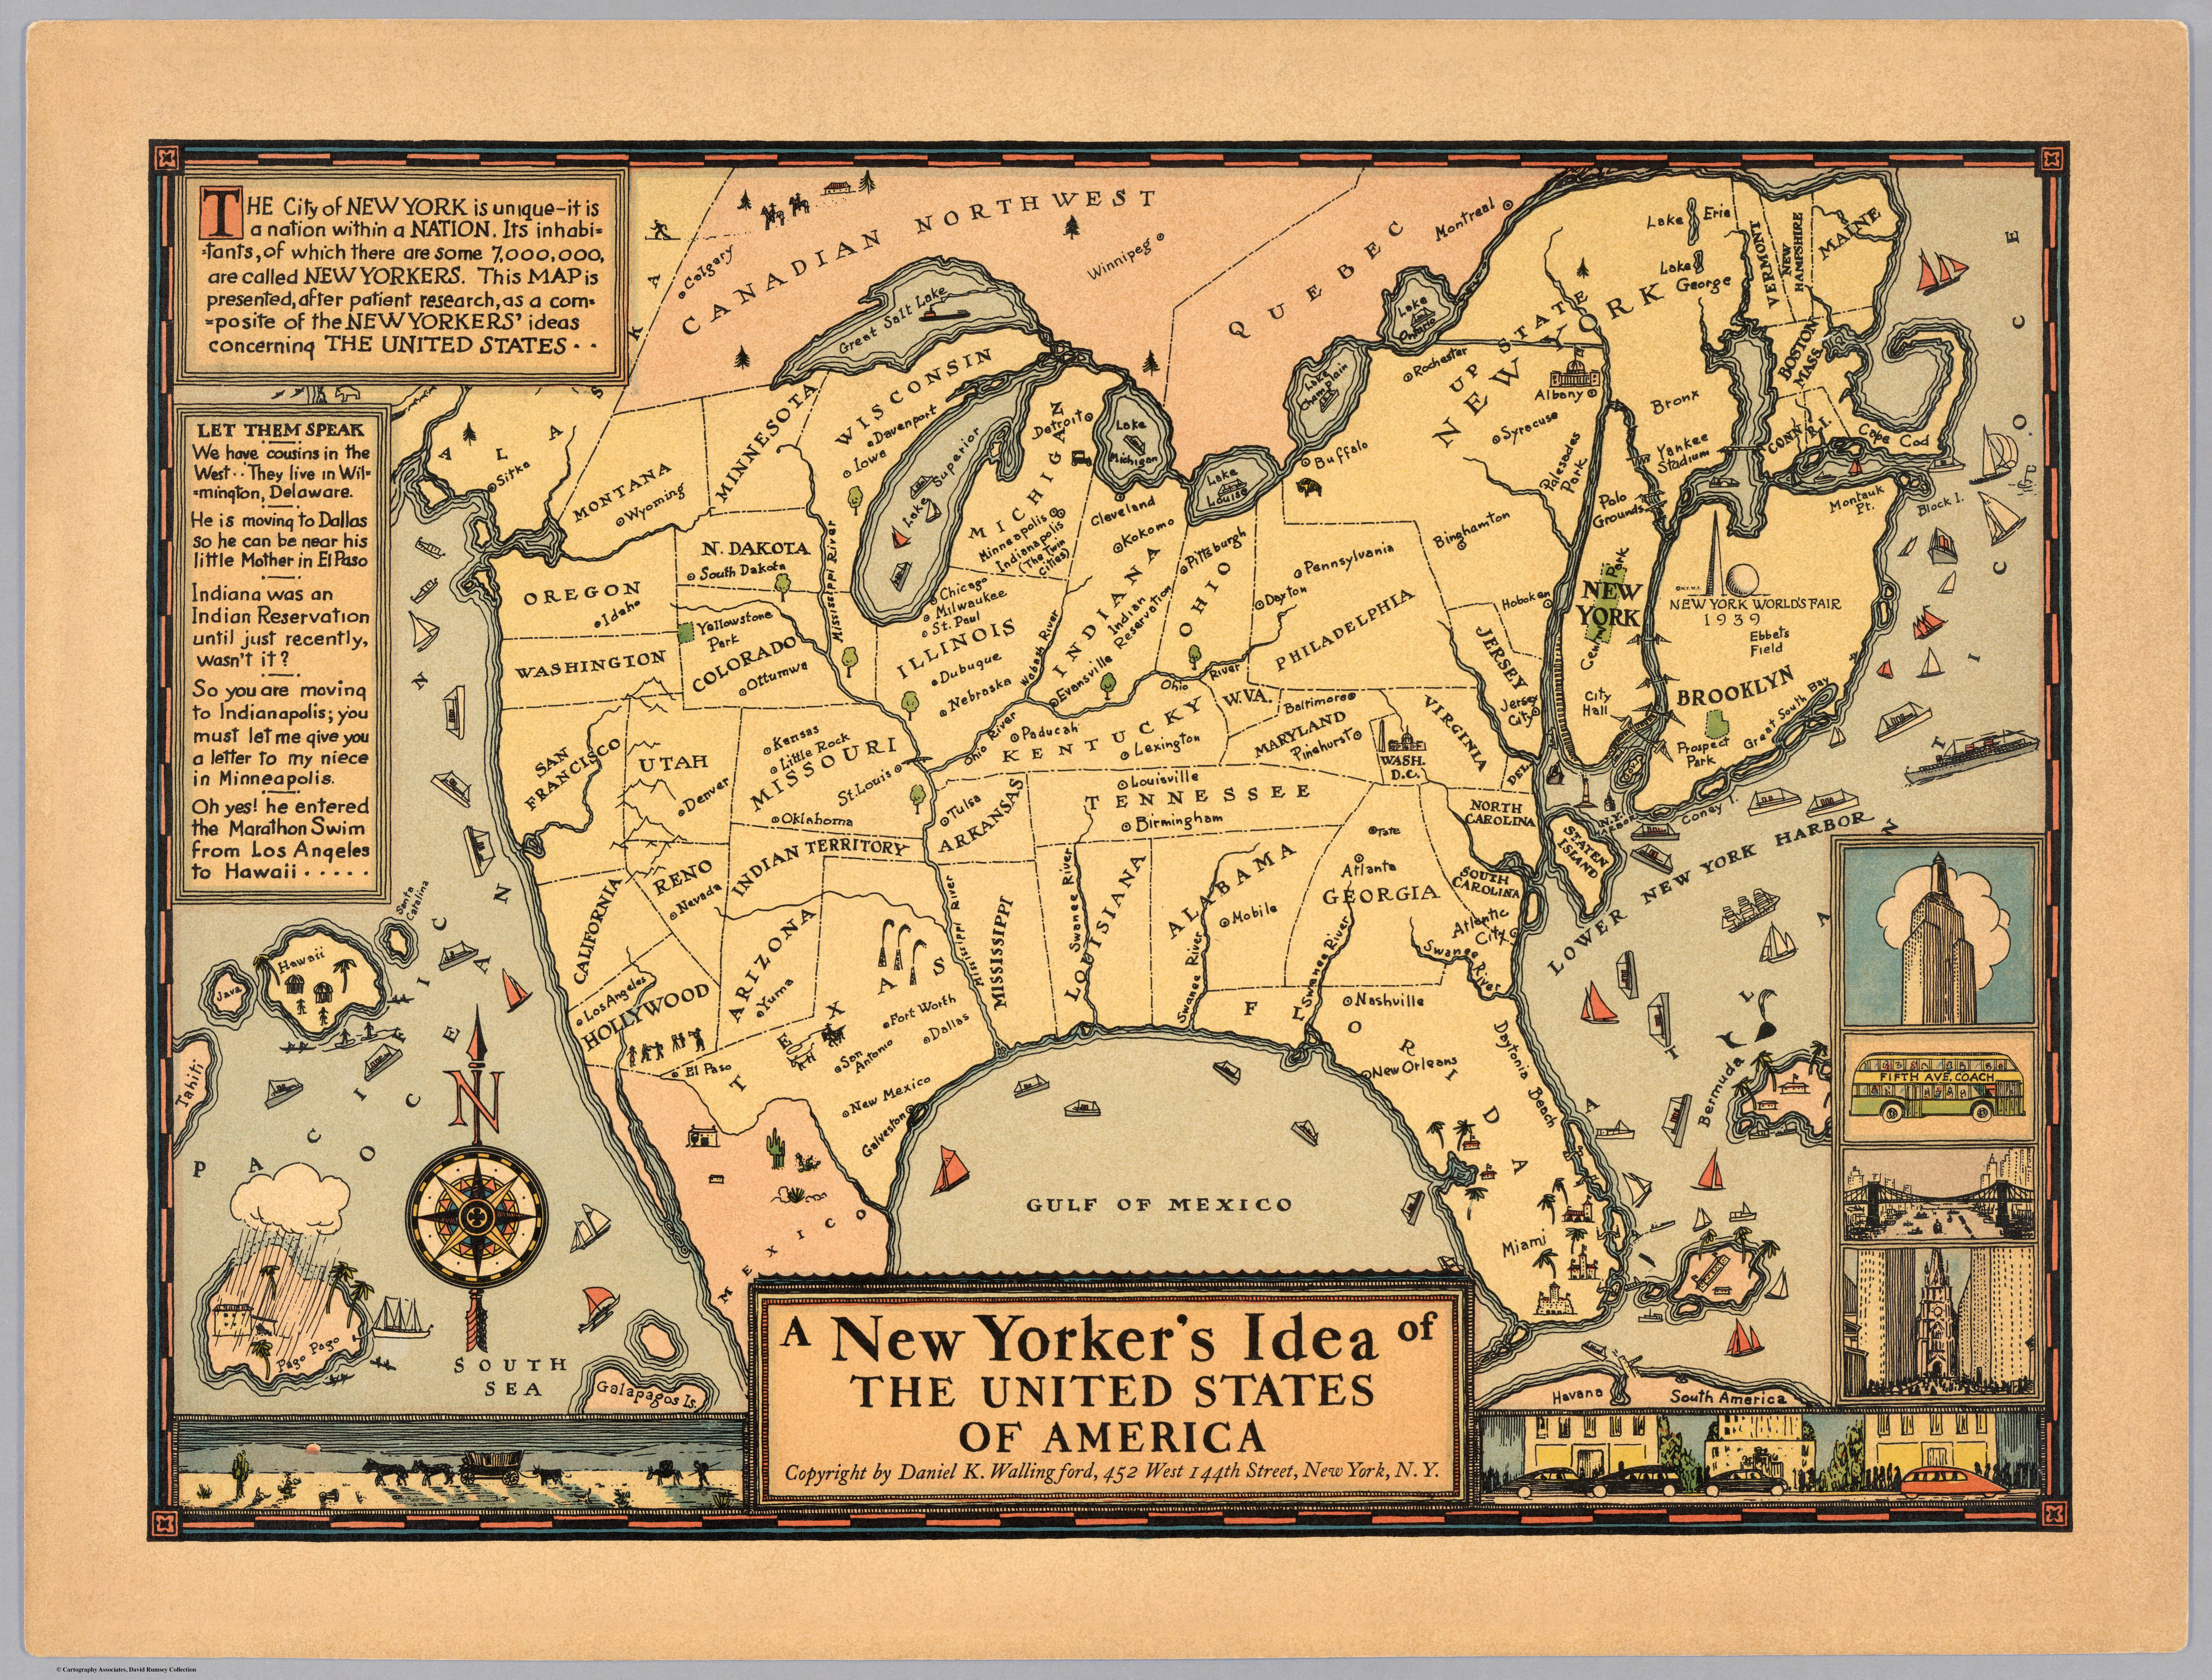
How New Yorkers see the Nation
Long before Saul Steinberg caricatured a New Yorker’s view of America, Daniel Wallingford did the same. The wildly inaccurate rendering of the country is done with sly attention to detail: the Great Plains is entirely absent, while the Far West is dramatically foreshortened. The five boroughs eclipse even the largest states in the Union. But in caricaturing the provincialism of New Yorkers, Wallingford also identified a more universal human tendency toward geographical parochialism.
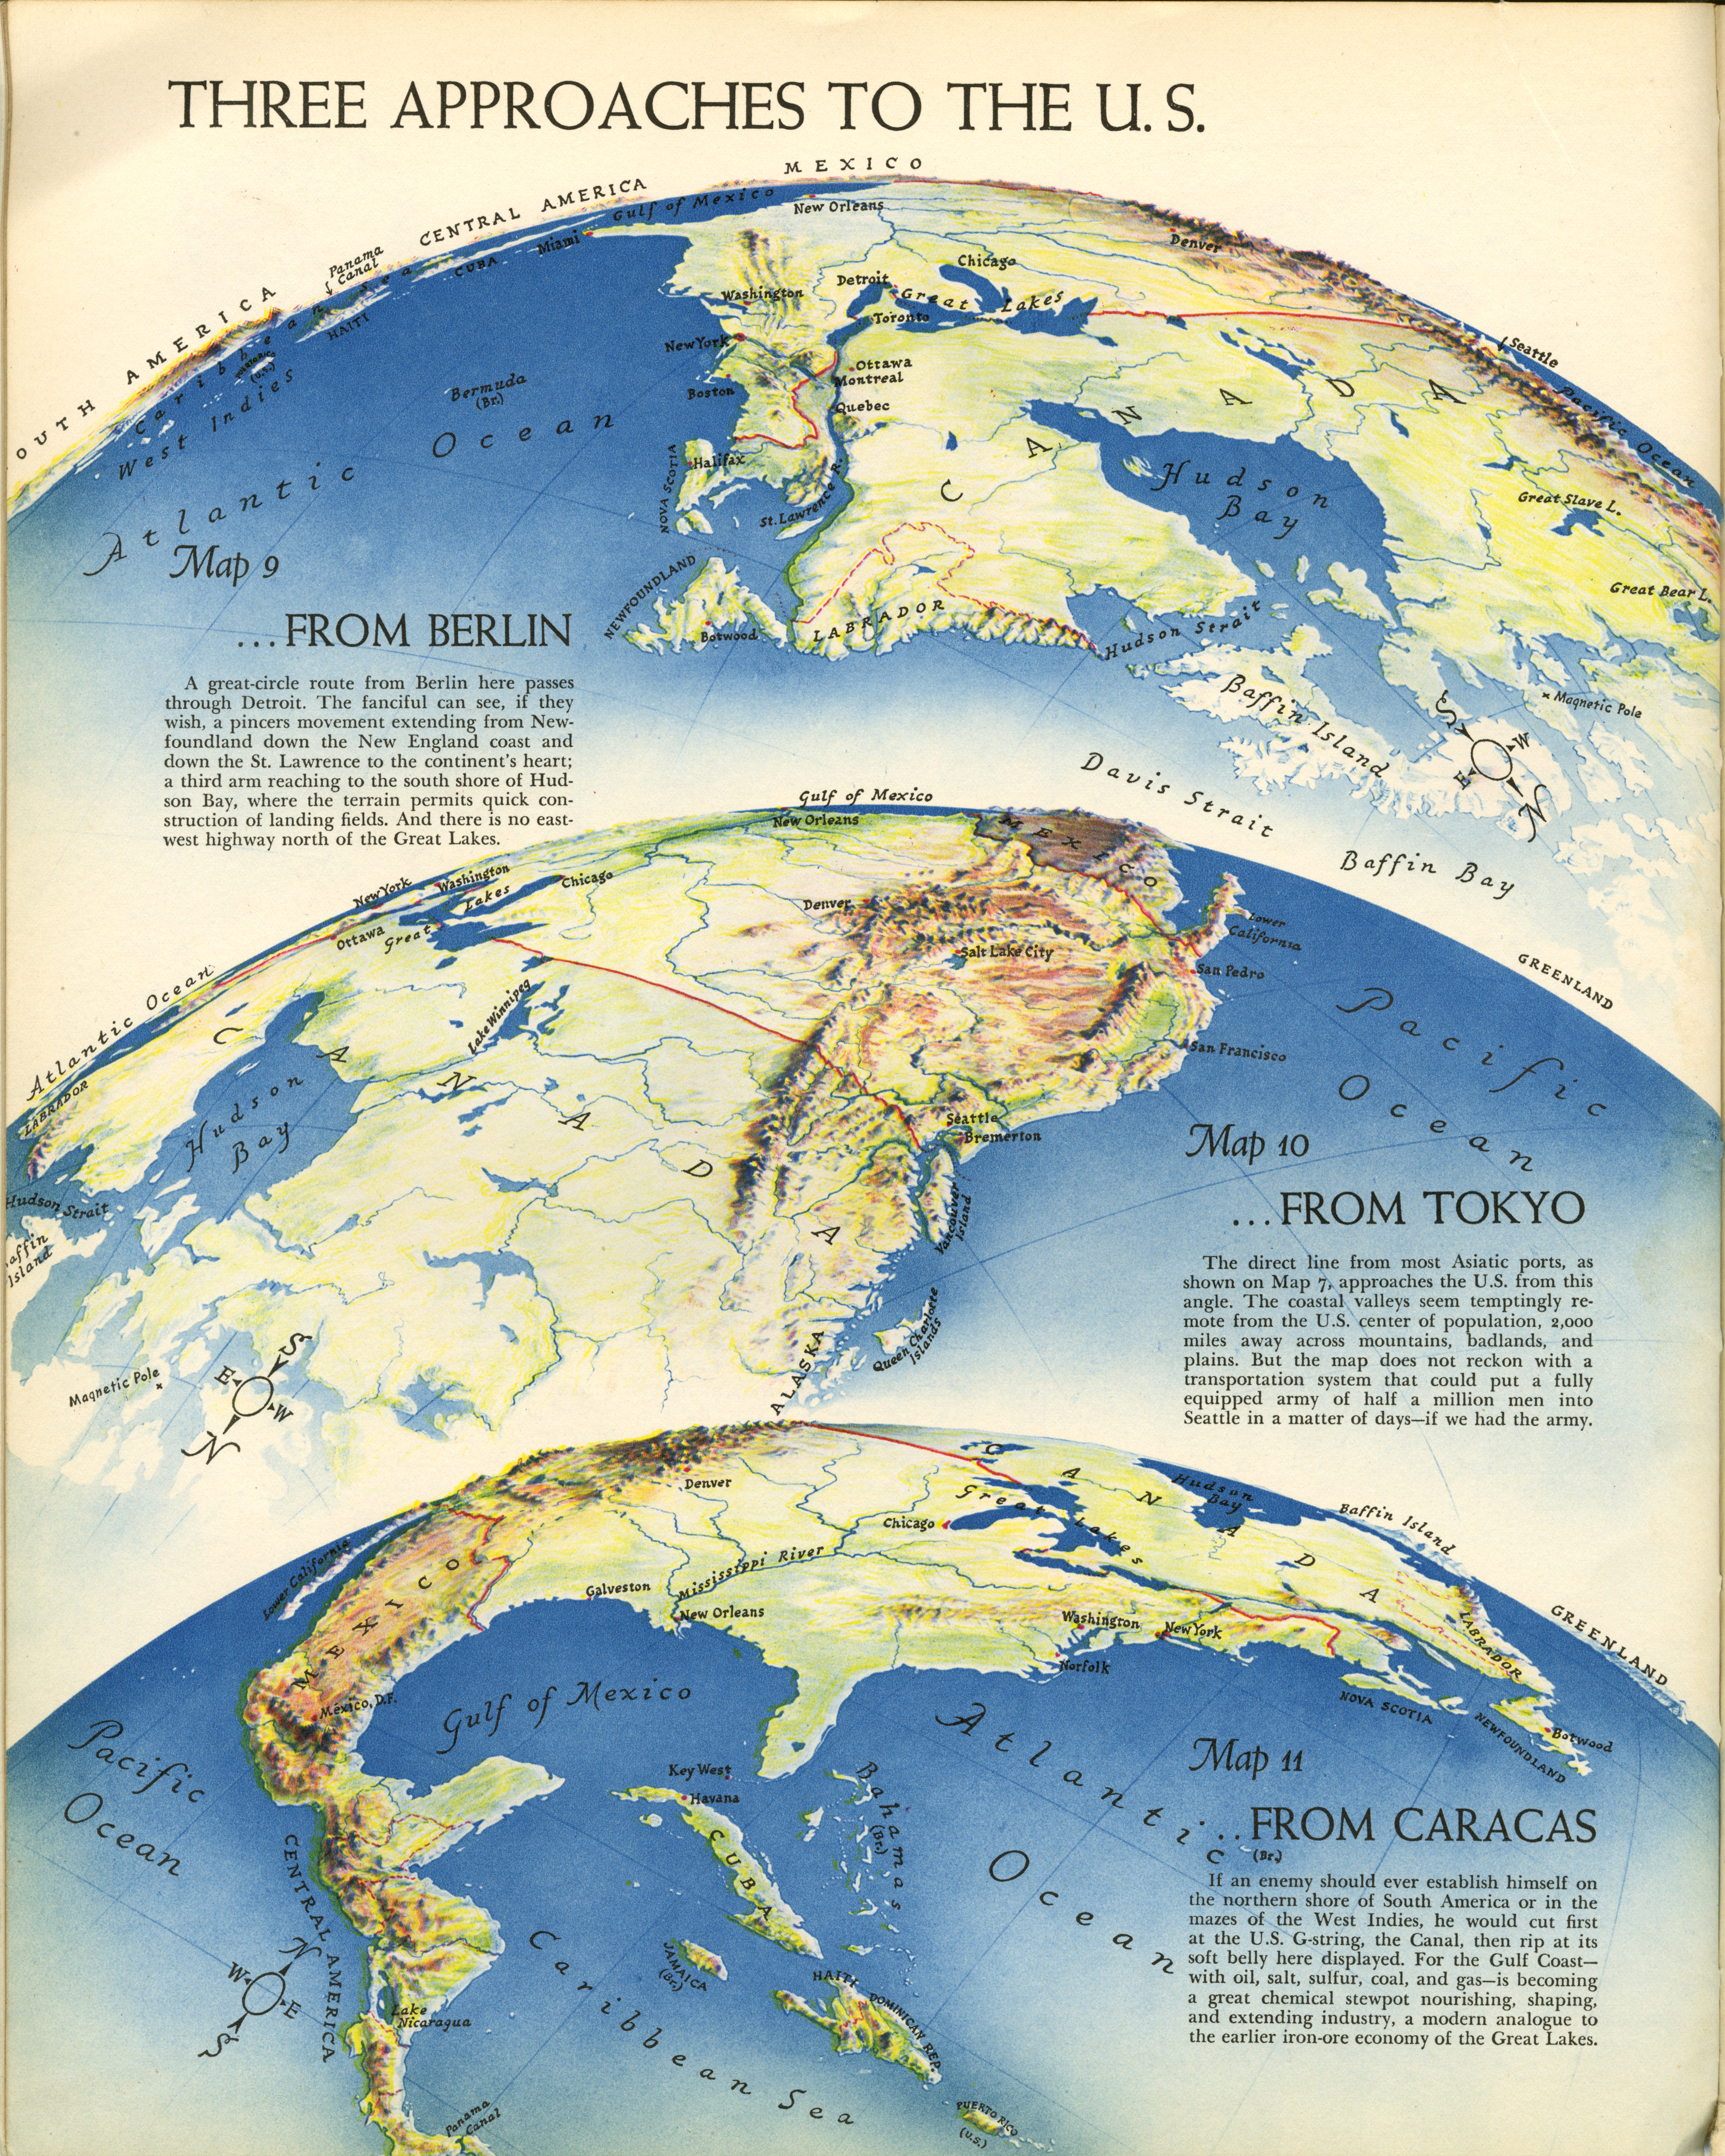
How War Reinvented Maps
As the Nazis marched through western Europe in 1940, many Americans assumed that the Atlantic Ocean protected them from Germany, just as the Pacific buffered them from Japan. Richard Edes Harrison directly challenged that sense of isolationism by using maps to highlight the proximity between the US and the rest of the world. Chapter eight profiles several maps that recalibrated the public’s awareness of space and distance in the age of war and aviation.
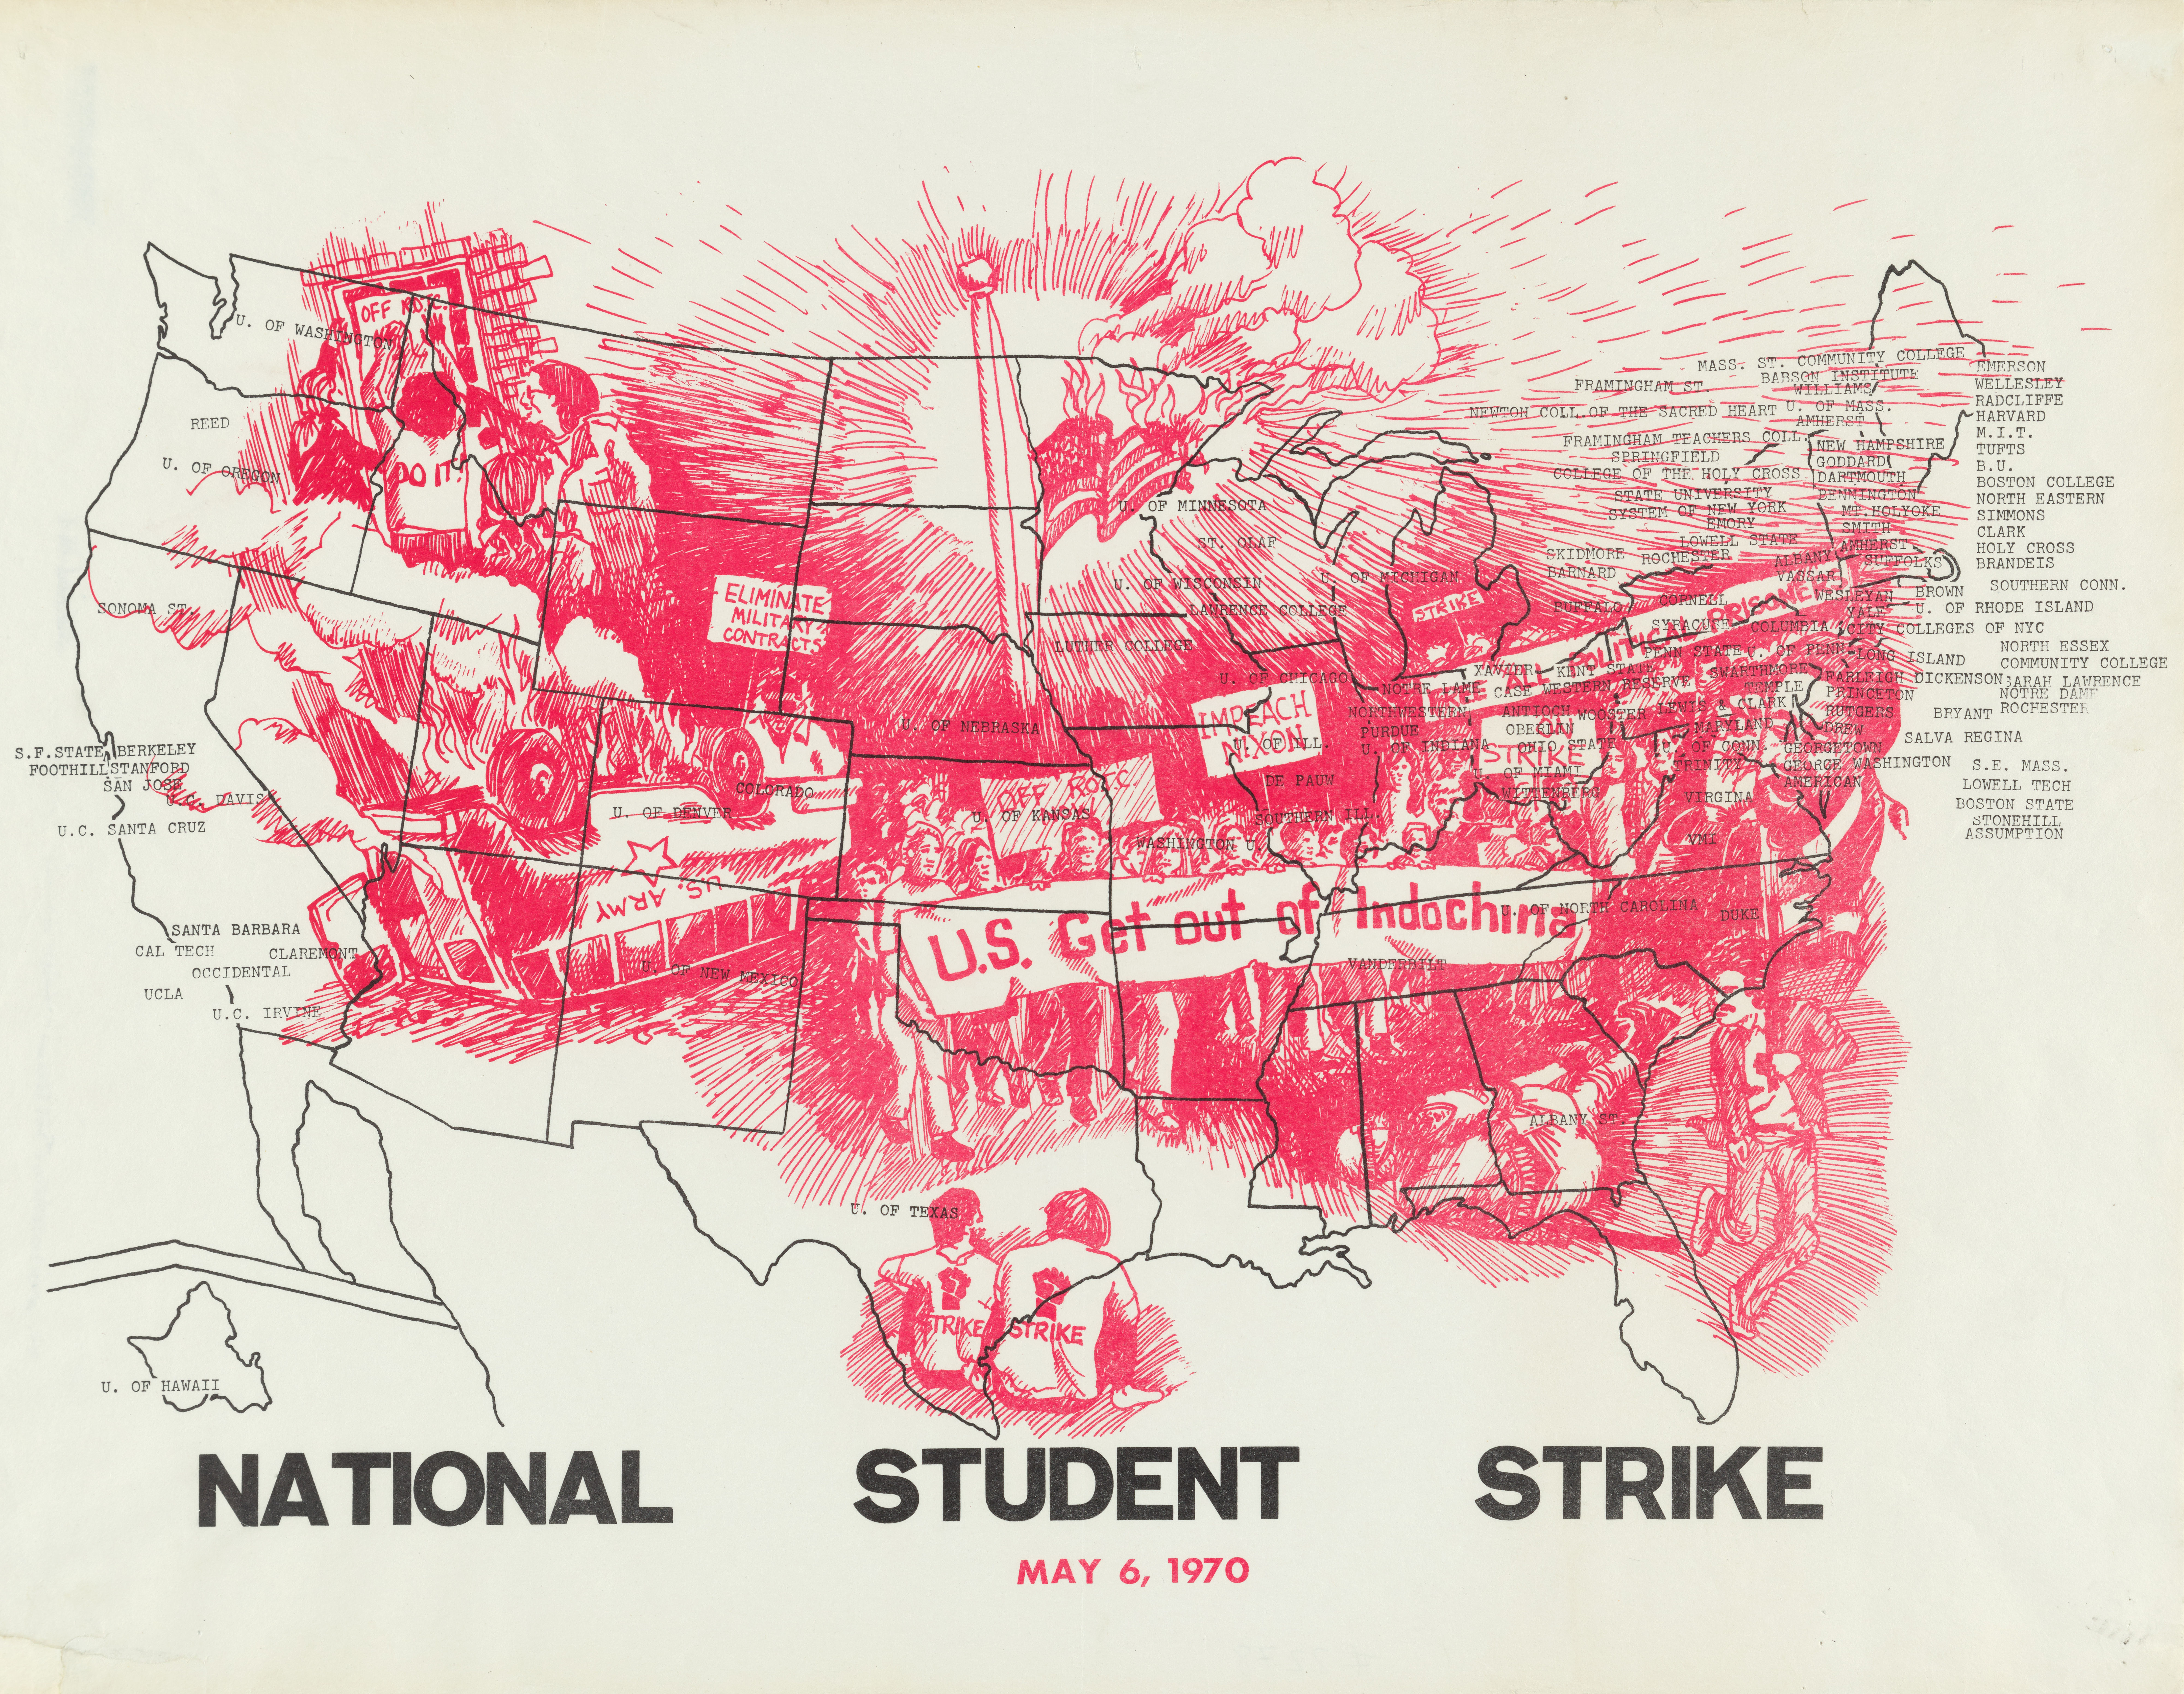
The Revolt Against the Vietnam War
By 1970 American college campuses had reached a boiling point. Years of escalation in Vietnam under both Presidents Johnson and Nixon drove a nationwide student boycott in May. The coordination of such an ambitious effort is captured on this map, which records the campuses that participated in the protest. Student demands are illustrated across the map, including not only the US withdrawal from Indochina but the removal of military recruiting on college campuses.
Like what you see?
